
Chapter 6. Normalization
The last version of the ISO standard regarding energy management, namely ISO 50001: 2018, has improved many things, defined them more clearly, and regulated them more consistently. However, many medium-sized companies have difficulties with the energetic evaluation of the required energy indicators due to the new regulation. These regulations have tightened for proof of improvement in energy-related performance. When looking at the energy performance indicator for the most considerable energy uses, the following is true: potential discovered and implemented means indicators develop "downwards," indicating improved energy efficiency.
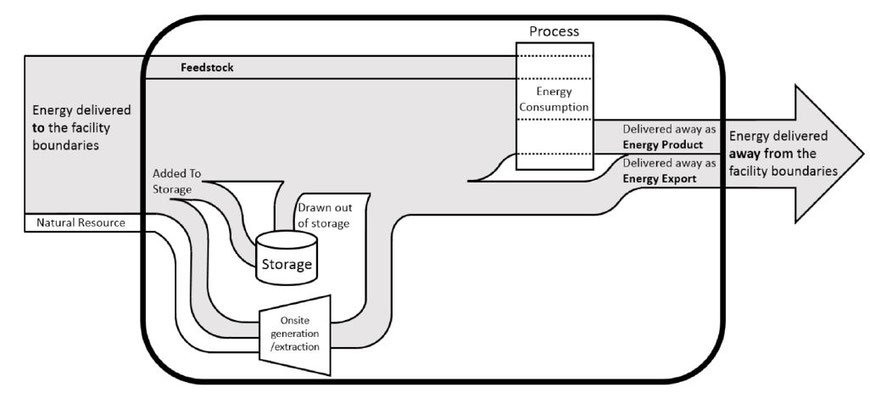
For the success of the energy strategy, an elementary consideration of its energetic activities is primarily necessary. From a thermodynamic point of view, can use the following energy balance equation for the entire company:
Stored energy = procured energy - the energy used + self-generated energy - energy losses
If there is no energy stored or self-generated, then the energy balance is as follows:
procured energy = energy consumed + energy losses
The term "procured energy" refers to the energy purchased from utility companies. To have to buy less energy, one would also have to reduce energy consumption and energy losses. We can reduce the energy consumption by reducing the normal load, the baseload, and the peak load. Mostly the normal load "normally" depends on the production process. That means an optimized operation of the systems and a reduction in energy consumption. We can reduce energy losses by increasing the energy efficiency within the systems themselves (e.g., introducing more efficient motors). All these factors can lead to better energy use or higher use (increasing the produced goods per used energy). To achieve the energy goals, you need clear guidelines and methodologies. ISO 50006 and ISO 50015 have developed methods that contribute to better energy planning and better evaluation and analysis of energy-related performance. These methods also make it possible to meet the requirements of ISO 50001: 2018.
The absolute energy consumption to verify the improvement of the energy-related performance is a lousy indicator since it would fluctuate with the production given the same technical efficiency.
The production quantity is a variable that significantly influences energy consumption but is determined by external influences such as the market situation, sales activities, profit targets, etc.
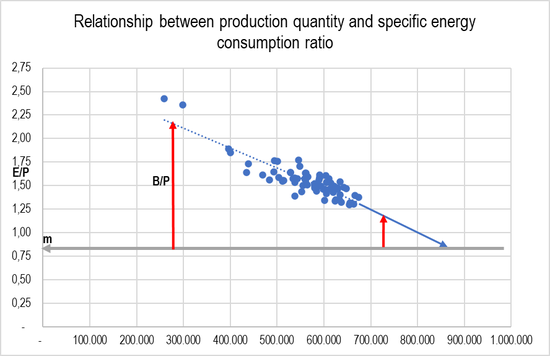
The indicator energy consumption per product quantity shows that the efficiency expressed is progressing or decreasing. In the meantime, the great potential, i.e., energy savings, have almost been exhausted. The improvements can be consequently minimal compared to the considered energy use - and some indicators can worsen.
The indicator "energy consumption per unit of output (here kg of product)" is already normalized, namely to the influencing factor production volume: more product, more energy. The problem with this consideration is that the desired normalization of the production volume is usually not complete.
The pandemic made it more evident: Production has fixed consumption rates that do not vary over vast areas with the production volume. These basic consumption levels are then "diluted" by increasing production, the indicator becoming smaller. The opposite effect occurs when production falls. The indicator alone says nothing about the production volume to which it relates, without additional offsetting.
The solution to this problem lies in the introduction of an expected value. According to the energy baseline model or regression function, these expected energy consumption values are compared with the actual measured energy consumption. Consumption values from different load periods are comparable and related to the energy baseline technical/operational energy efficiency. A suitable energy performance indicator, EnPI, results from the ratio of the measured energy and the expected value or the normalized energy consumption.
EnPI = E (measured) / E(m, B)
EnPI <1 shows an improvement
EnPI> 1 shows a deterioration
Above all, one had to accept more significant sales reductions - and lower production hurt the indicators. And this is precisely where the substantial changes in ISO 50001: 2018 take effect. We can record such influences quantitatively, and we can develop methods to "subtract" them from the indicator.
It means nothing else by the requirement to normalize the energy performance indicators (EnPI). We can see from the energy data that relevant variables significantly affect energy performance to normalize the EnPIs and the corresponding energy baseline.
Variable values for the reporting period are used in the regression to determine the expected value that would have been expected if the parameters had remained the same. It is called normalized energy, E(m, P). It includes the overall effect of all parameters. To evaluate changes (also concerning statistical relevance), the relative change to the expected value E is decisive.
A complete normalization creates a direct comparison between energy consumption on the energy baseline and energy consumption in the assessment period - regardless of the specific value of relevant variables, such as the production volume. We can achieve this by determining the specific relationship between production volume and energy consumption in E = mP + B from operational data. That means: From a certain number of value pairs E and P, which are available from the production history, the variables m and B are determined by linear regression.
Therefore, a complete normalization must compare the measured energy consumption with that which would be expected from the energy baseline with the m and B values.
The above considerations show the primary background considerations. In practice, we must then consider at least the handling of the statistical uncertainties of linear regression. Also, in many cases, several variables will play a role. It makes computational processing more complicated. The fundamental considerations described above remain valid. However, in each case, one will have to decide which concretizations of these considerations are appropriate and suitable or whether physical modeling or statistical model should be used.
The approach with the ratio of energy per quantity is no longer meaningful. As explicitly required in the new standard, consistent normalization significantly increases data storage and evaluation demands.
Forecast normalization
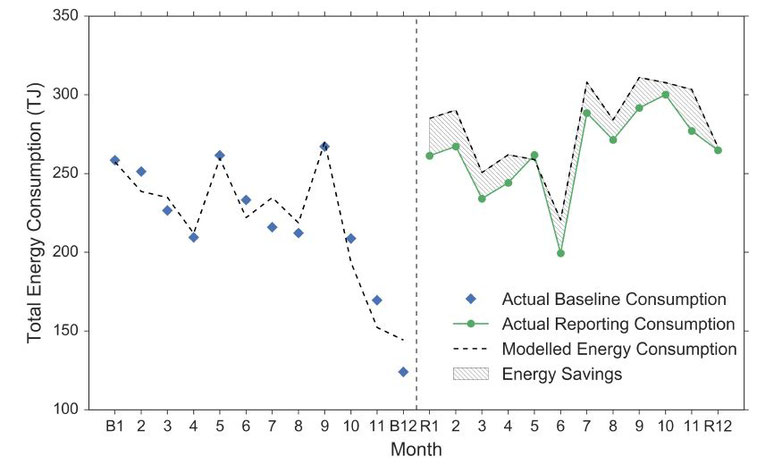
The predictive normalization compares the current consumption from the reporting period with normalized values from the reference period to forecast the future consumption due to relevant variables (e.g., total production quantity or outside temperature). Of course, nothing else apart from these variables must fundamentally change.
The resulting values for the total energy consumption are then compared with the reference model from the baseline year to measure energy-related performance improvement through implemented energy-saving measures.
The mathematical model is checked every year to determine whether production or the outside temperature can continue to act as the main influencing factor in the future. The results can show if the production volume can still be included as the main influencing factor (correlation factor of the curve energy consumption vs. production volume). Together with other models, this model can carry out the energy planning for the coming year.
Backcast normalization
With backcast normalization, the current consumption values are normalized, a function is formed from this again, and the reference period's relevant variable values are inserted into this function.
The result says something about how high the energy consumption would have been if we had produced a certain quantity and outside temperatures in the reference period.
Normalization with reference conditions
The normalization with reference conditions normalizes consumption from the reference period and the reporting period with reference data and compares them.
For this method, it is necessary to select reference data with specific historic and likely future data, e.g., for production figures and weather data with average values. This model is independent of the reference period's data since own data (reference data) are used. This model makes sense if the reference period's data are somewhat atypical, as is the case with weather data and a different product mix.
Degree day number for energy consumption
The degree day number method is a common approach, especially when it comes to temperature fluctuations. The "normal" state is determined by a degree day number that has been determined and averaged over the years. It also depends on the location. When using degree day numbers, a heating limit and the desired room temperature are set. We also have to measure the outside temperature ourselves.
If the outside temperature now exceeds the specified heating limit, there is no change. If the temperature falls below the heating limit, the difference between desired room temperature and the outside temperature is calculated. These are added up over the different days of the year- location-dependent. The long-term value is then divided by the value determined for the current year or the current period. We get a correction factor. We multiply the energy input or EnPI - and the weather influence is mostly compensated.
Conclusion
We obtain then detailed statistical analyses. And the most exciting thing is the effectiveness of the models. The goal is not to create a single predictive model. Instead of finding a regression equation to predict and a random model, we are trying to build as many predictive models as possible and then average the results. From data analysis and data science, the predictions' average is usually more accurate than a single prediction when it comes to predictions. We can select the mean of all expected values of the different models as the reference model for these reasons.
Write a comment